Child Malnutrition Comparison Graphics
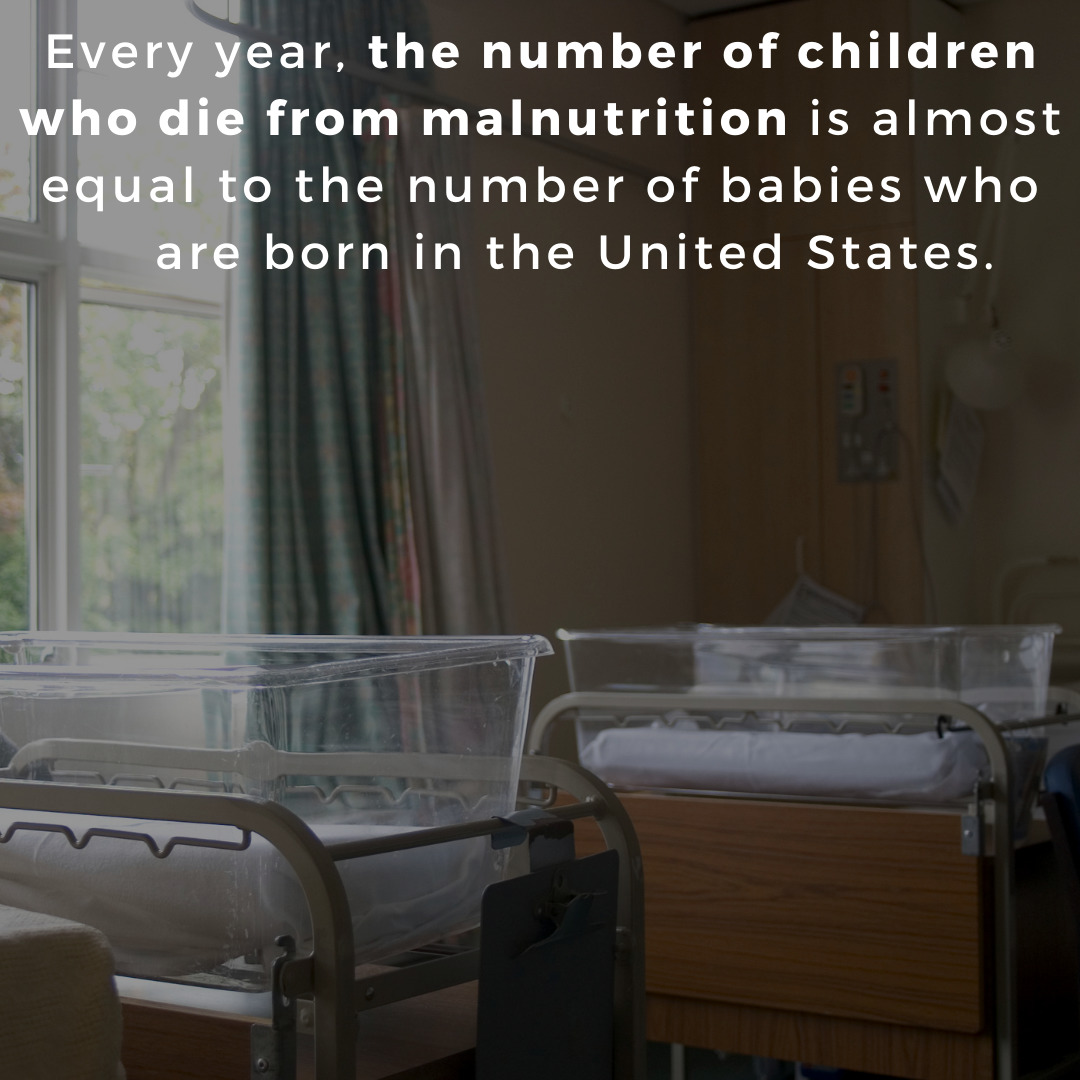
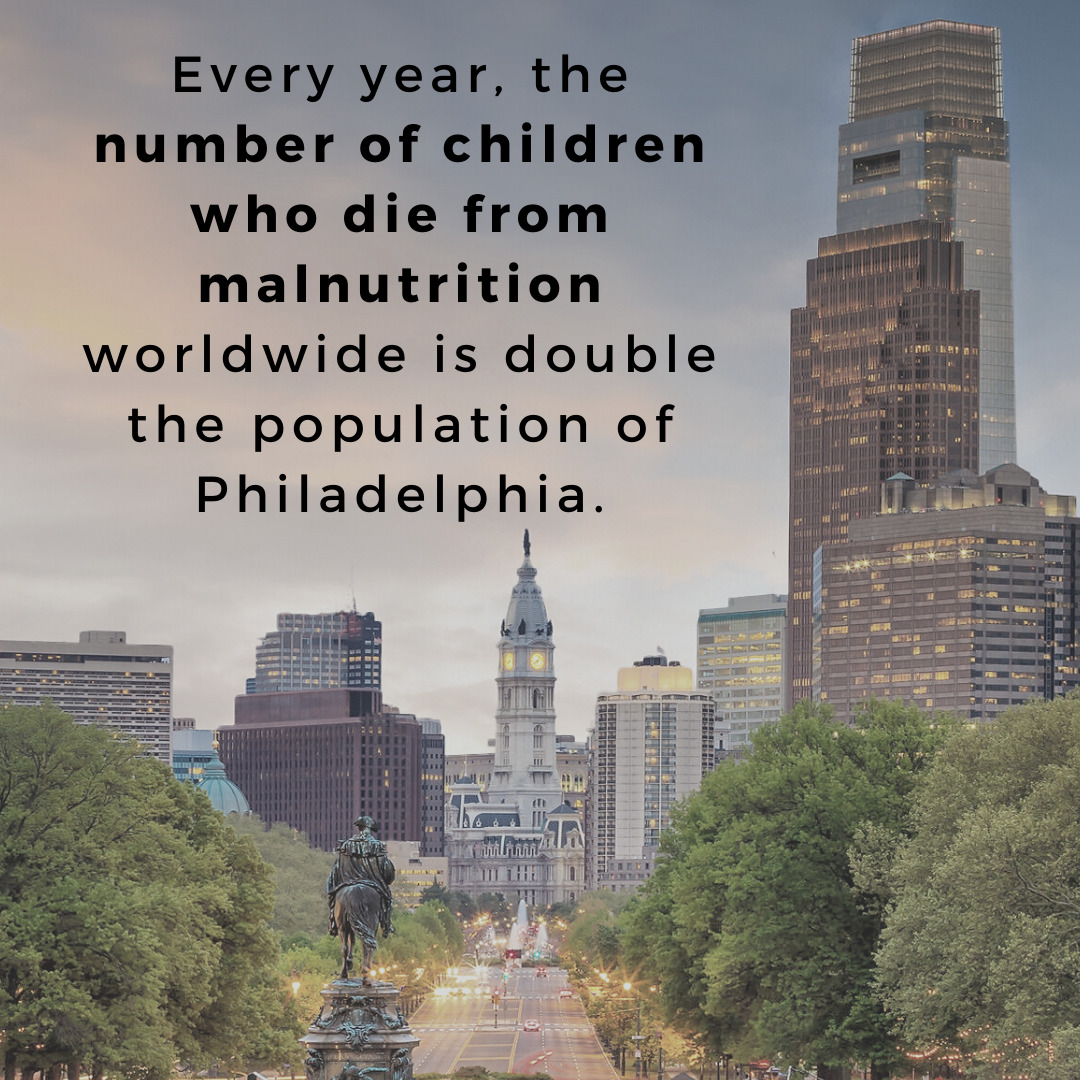
Below are graphics putting global child malnutrition deaths in perspective by comparing them to other more common statistics.
Below are graphics putting global child malnutrition deaths in perspective by comparing them to other more common statistics.
Below are graphics putting child malnutrition deaths in perspective by comparing them to the populations of district-specific geographical locations. These graphics can be used by advocates to engage with Members of Congress, in op-eds, talking points, on social media and in any other collateral. The district-specific locations were chosen based off information on policymakers’ involvement with nutrition issues.
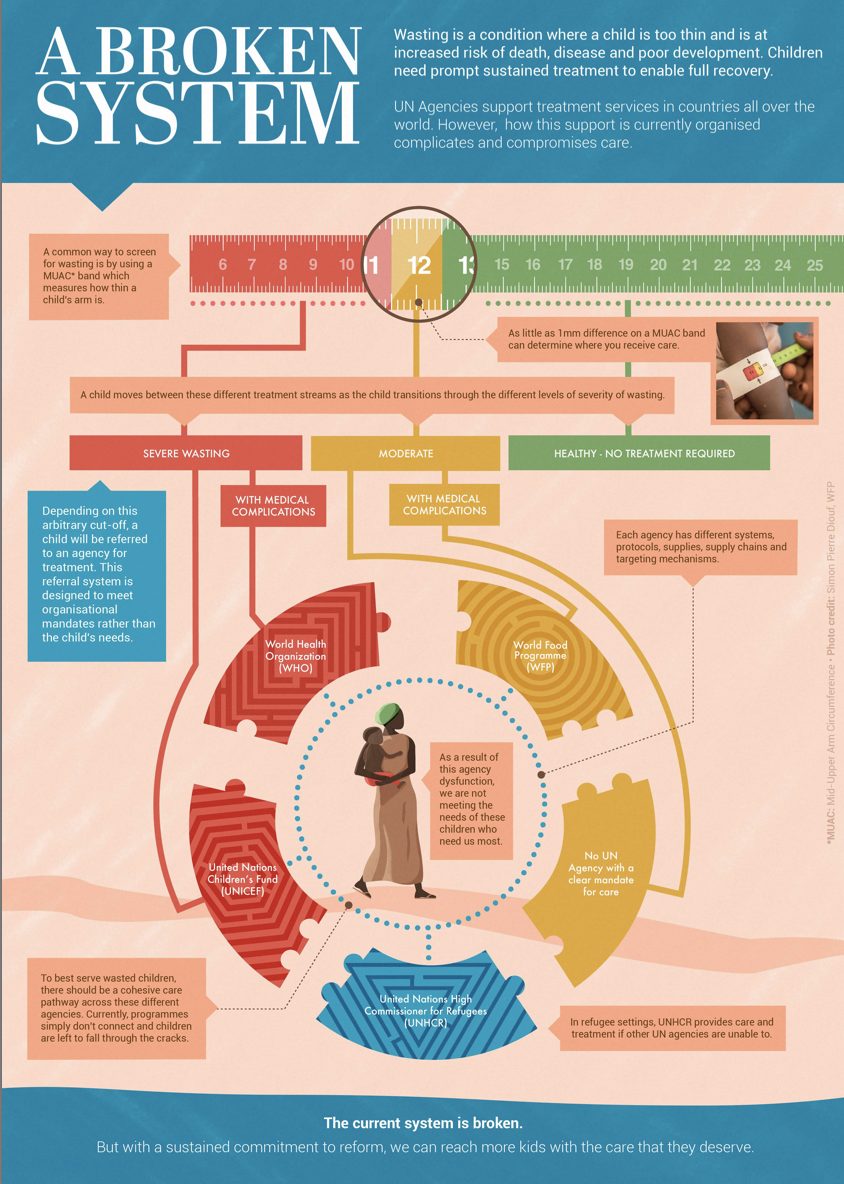
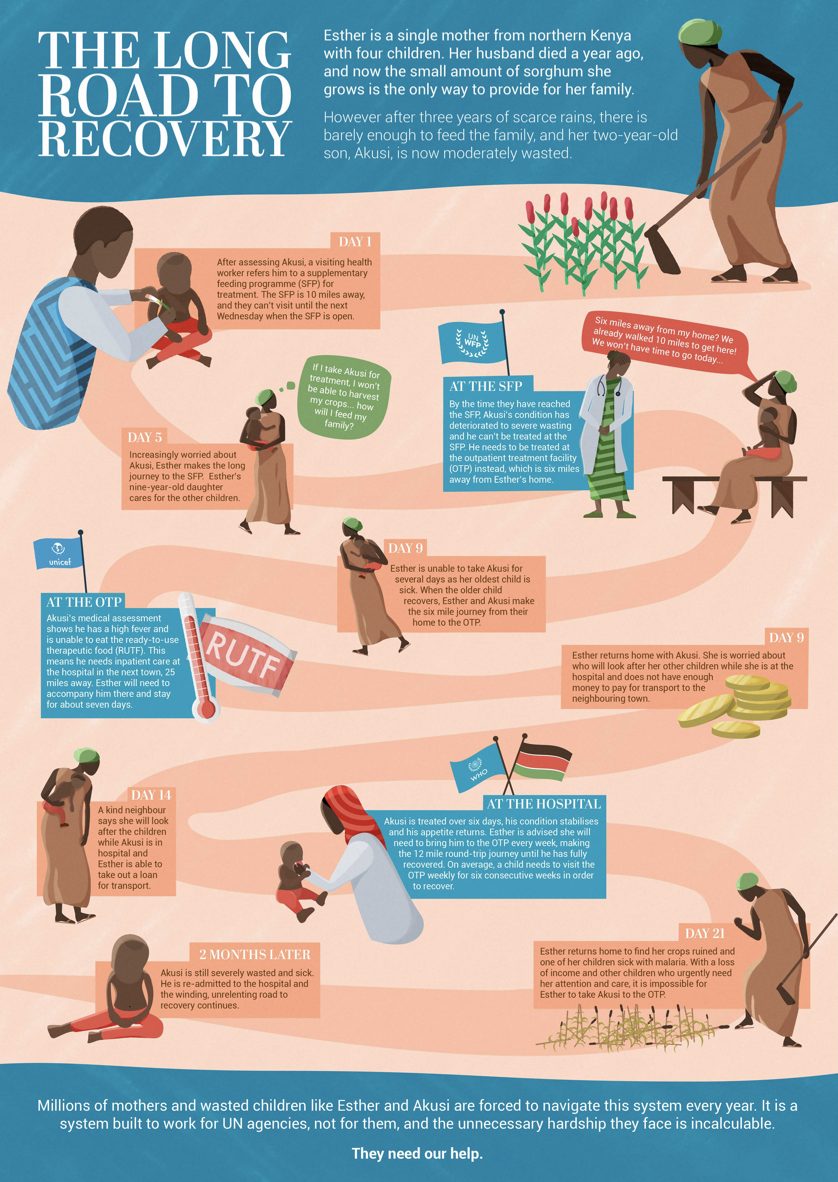
In collaboration with the Emergency Nutrition Network (ENN) and the Eleanor Crook Foundation (ECF), 1,000 Days developed this infographic—one in a series—to highlight the way that the current UN system for treating wasted children complicates and compromises care.
In collaboration with the Emergency Nutrition Network (ENN) and the Eleanor Crook Foundation (ECF), 1,000 Days developed this infographic—one in a series—to highlight the way that the current UN system for treating wasted children complicates and compromises care.
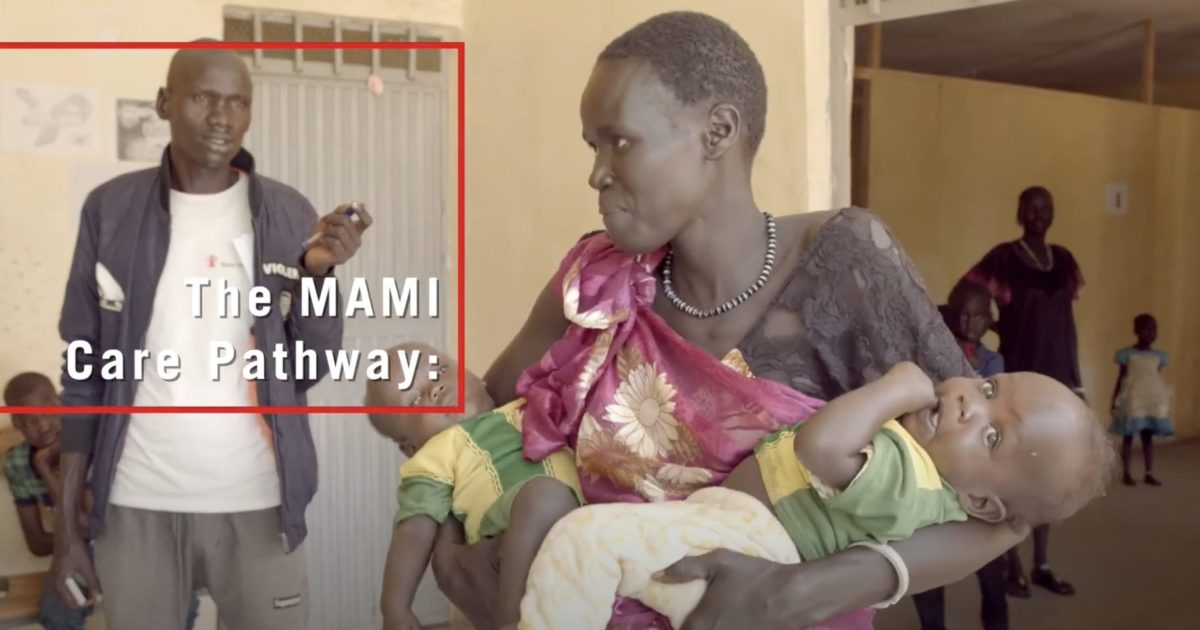
The vision for MAMI is that every infant under 6 months is nutritionally assessed and appropriately supported to survive and thrive, at every community and health-service contact.
In this short video Save the Children share experiences from the field of utilizing the MAMI Approach in Bangladesh and Ethiopia to save the lives of vulnerable infants who may otherwise be missed. To see the MAMI Tool for programming from Save the Children and GOAL, visit here.
MAMI can help save the lives of vulnerable infants.
But we need your help: To see them. To assess them. To provide support.
Contact: mami@savechildren.org for queries and further support.
This video was developed by Save the Children in collaboration with GOAL, with financial support from Eleanor Crook Foundation (ECF) and technical support from the MAMI Global Network.
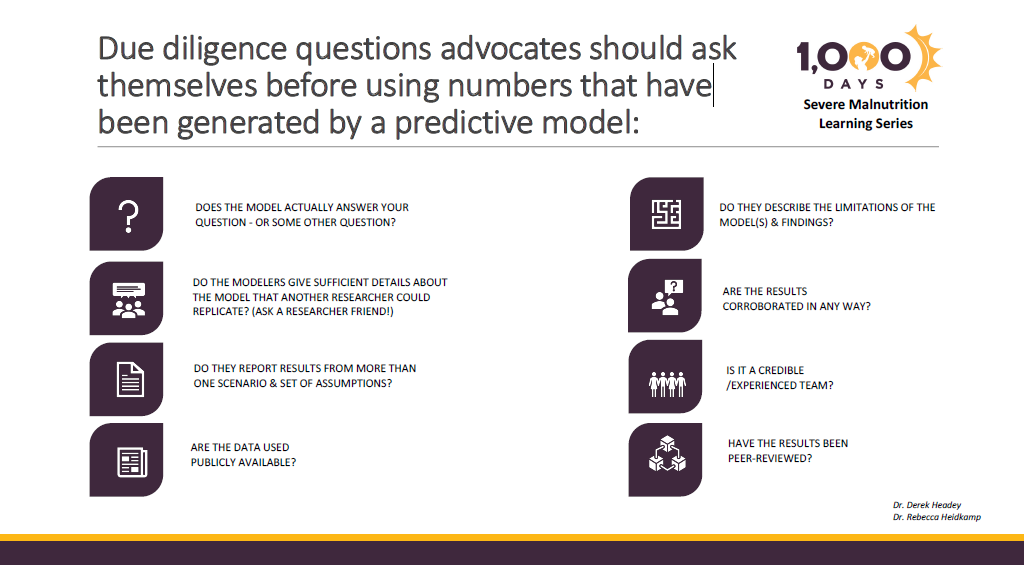
A list of questions advocates should ask themselves before using numbers that have been generated by a predictive model. The information came from a 1,000 Days Severe Malnutrition Learning Series webinar “Predictive Modelling for Nutrition: Using Projections to Enhance Advocacy” and was provided by speakers Dr. Derek Headey, Senior Research Fellow in the Poverty, Health and Nutrition Division at the International Food Policy Research Institute (IFPRI) – Myanmar and Dr. Rebecca Heidkamp, faculty member in the Center for Human Nutrition, Department of International Health at the Johns Hopkins University (JHU) Bloomberg School of Public Health.
The release of Field Exchange 60 coincided with UN Agencies global initiative to determine how they could provide a more unified response to care for wasted children. In March 2020, five UN agencies (UNICEF, WFP, WHO, UNHCR, FAO) published the Global Action Plan (GAP) on Child Wasting: A Framework for Action (see box 2). In May 2020, the Field Exchange Team reviewed the Field Exchange 60 priority actions relative to the GAP Framework. This brief outlines findings to help inform next steps in the development and finalisation of the GAP on Child Wasting.
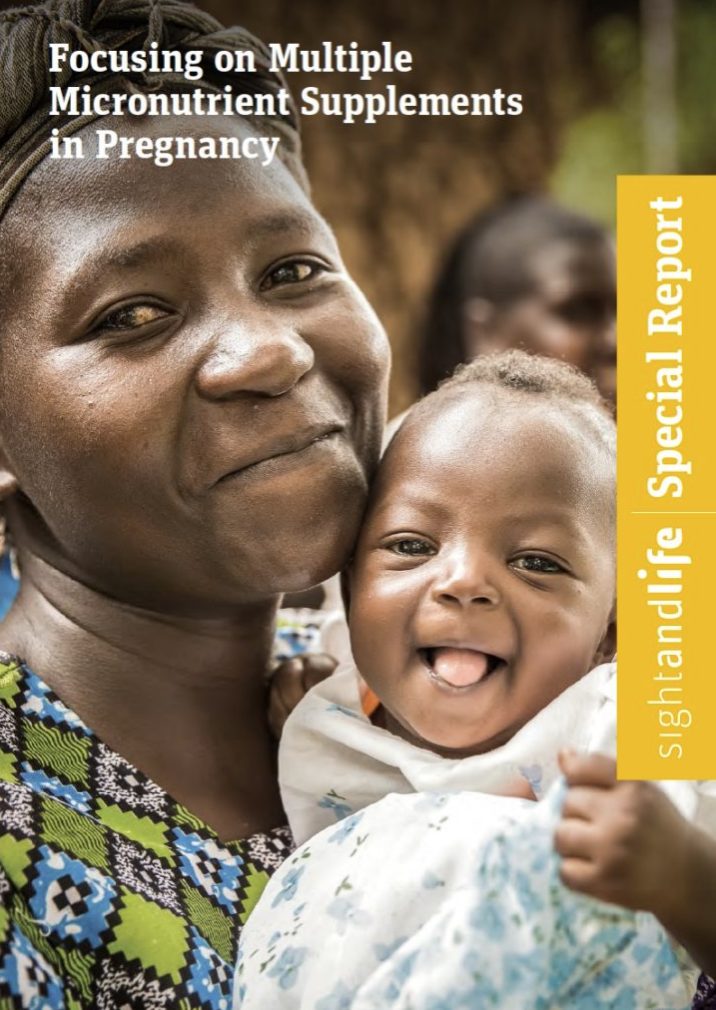
This Sight and Life Special Report: Focusing on MMS compiles and curates the latest evidence, experience from the field and resources for scale-up. It aims to serve as an important resource for decision-makers and implementers, thereby driving the introduction and adoption of MMS.
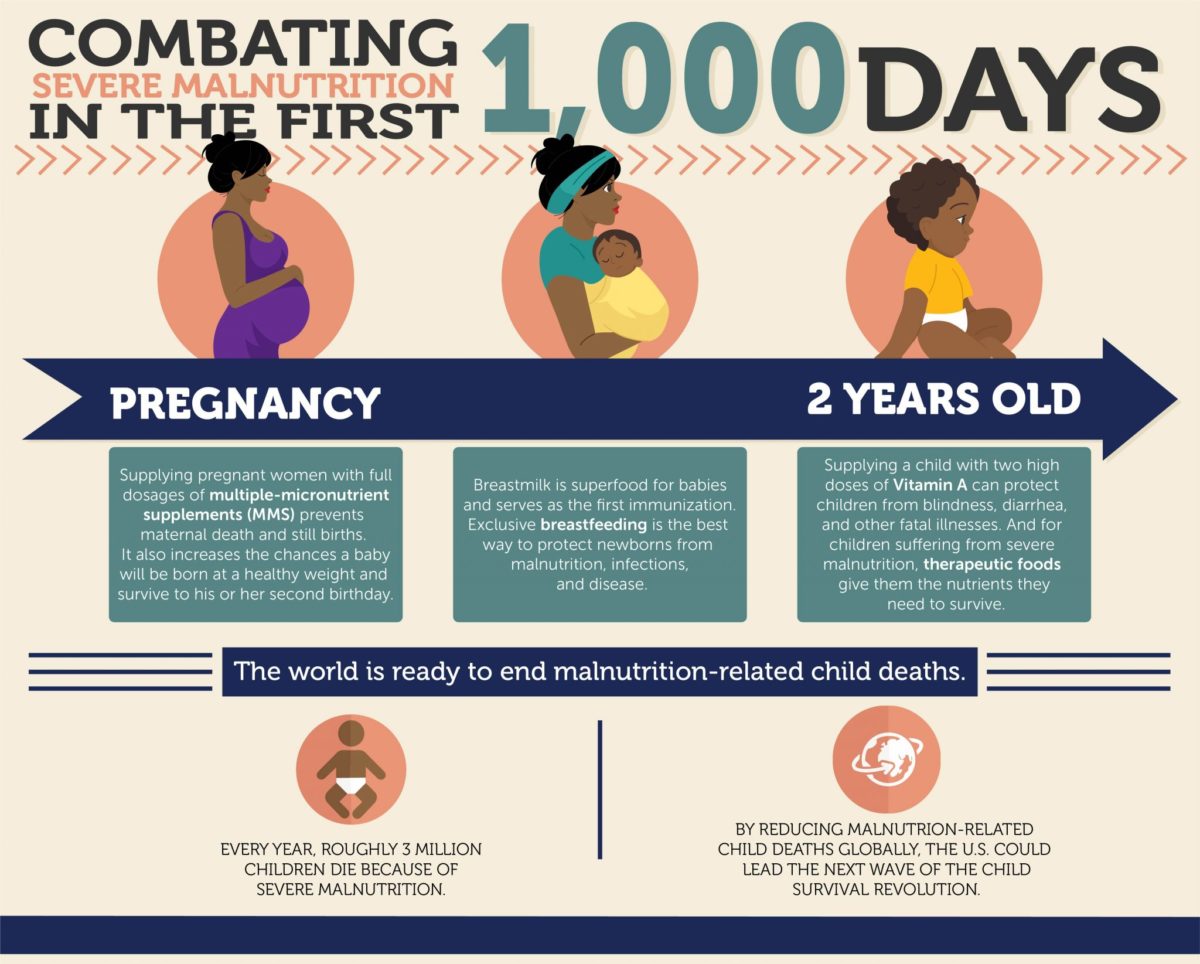
This infographic shows specific nutrition interventions that span the course of the critical 1,000-day period between a woman’s pregnancy and a child’s second birthday when there is a unique window of opportunity to build healthier and more prosperous futures for mothers and their babies.
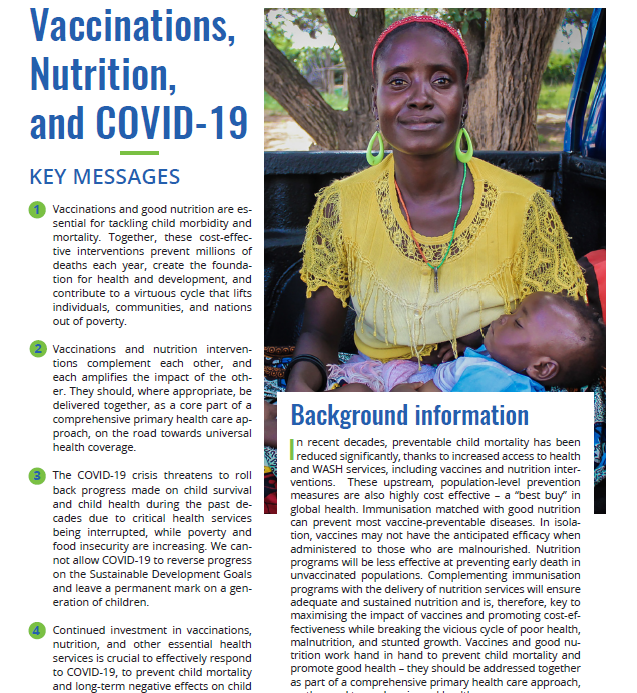
Key messages about how vaccinations, nutrition, and COVID-19 are connected. The following organizations contributed to this messaging: Scaling Up Nutrition (SUN), 1,000 Days, ACTION Global Health Advocacy Partnership, HarvestPlus/IFPRI, Save the Children Japan, Save the Children UK, Eleanor Crook Foundation, Power of Nutrition, RESULTS UK, and Nutrition International.