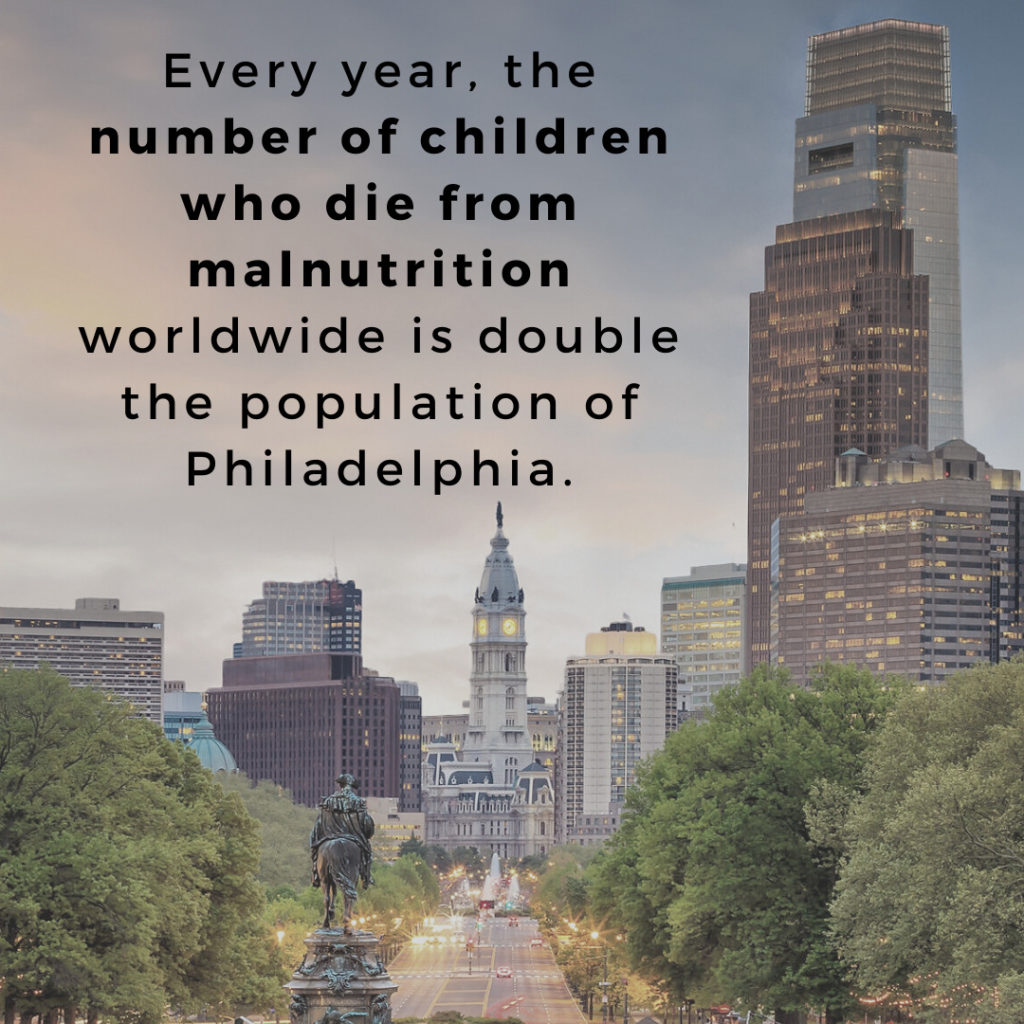
Below are graphics putting child malnutrition deaths in perspective by comparing them to the populations of district-specific geographical locations. These graphics can be used by advocates to engage with Members of Congress, in op-eds, talking points, on social media and in any other collateral. The district-specific locations were chosen based off information on policymakers’ involvement with nutrition issues.

